The Ultimate Guide to the IELTS Writing Task 1 Checker
Why You're Still Stuck at Band 6 in Task 1, and How an AI Analyst Can Fix It in 10 Seconds.
Let's be honest. You've probably spent countless hours perfecting your Task 2 essays. You know how to build an argument, how to structure a thesis, and how to write a powerful conclusion. But when it comes to Task 1—that dreaded line graph, pie chart, or process diagram—something just doesn't click. Your score remains stubbornly stuck at a 6.0 or 6.5, dragging down your overall Writing band.
Sound familiar? You're not alone in the Task 1 struggle
If it does, it’s because you’ve been fed a lie. You’ve been told that Task 1 is an “English writing” task. It’s not.
IELTS Writing Task 1 is a junior data analyst report.
Understanding this fundamental difference is key to achieving Band 7+. Learn more about how examiners evaluate your writing in our Band Descriptors Deep Dive.
The examiner isn’t looking for your beautiful prose or creative flair. They are testing one thing: your ability to interpret data, identify key trends, and report them logically to someone who hasn't seen the chart. Most students fail because they approach it like an essayist, when they should be thinking like an analyst.
In this supporting guide, we are going to completely rewire your approach. I'll expose the four "deadly sins" that keep your Task 1 score stagnant and show you how a powerful IELTS Writing Task 1 Checker can act as your personal AI data analyst, helping you spot and fix these errors with precision.
The 4 Deadly Sins: Why Your Task 1 Score Isn't Improving
Four common mistakes that trap students at Band 6
If your score is stuck, it's almost certainly because you're unintentionally committing one or more of these cardinal sins. Let's diagnose them.
Sin #1: The Sin of Data Dumping (The "Tour Guide" without a Map)
🚫 The Symptom:
Your report reads like a chronological list. "In 2010, the number was 10%. Then, in 2011, it rose to 15%. In 2012, it fell to 12%..." You describe every single data point without highlighting what's important.
💡 The Root Cause:
You are acting like a tour guide reading every street sign, instead of an analyst identifying the key landmarks. The examiner doesn't want a list; they want insight.
Sin #2: The Sin of Repetitive Vocabulary (The "Broken Record")
🚫 The Symptom:
Your entire essay is a monotonous loop of increased, decreased, went up, and went down. The same few adjectives (significant, slight) appear again and again.
💡 The Root Cause:
You have a limited toolbox. To describe data effectively, you need a rich vocabulary to express not just the direction of a trend, but also its speed (sharply, gradually), magnitude (substantially, marginally), and nature (fluctuated, plateaued).
Sin #3: The Sin of Missing the Big Picture (The "Forest for the Trees")
🚫 The Symptom:
You dive straight into the details without first providing an Overall summary. Or, your Overall statement contains specific numbers or percentages, which is a classic mistake.
💡 The Root Cause:
You don't understand the fundamental structure of a report. The Overall paragraph is the single most important part of your Task 1. It's the executive summary that tells the reader the main story of the data before they dive into the details.
Sin #4: The Sin of Flawed Comparison (The "Parallel Universes")
🚫 The Symptom:
You have two lines on a graph, Line A and Line B. You write one paragraph describing the entire journey of Line A, and a second paragraph describing the entire journey of Line B. You never make them "talk" to each other.
💡 The Root Cause:
You are describing data points, not relationships. The core of data analysis is comparison. Where did Line A overtake Line B? Was the gap between them widening or narrowing? These comparisons are where the higher band scores are won.
You have just seen the four biggest Task 1 score killers. Check your own report now and see which one is actually dragging your band down.
Free scan first. No credit card required.
From Checker to Analyst: How AI Solves the 4 Deadly Sins

AI transforms from a simple checker to your personal data analyst
Recognizing these sins is the first step. But how do you fix them in your own writing, especially when you're under pressure? This is where a simple "checker" evolves into an "analyst." Here's how the AI at our platform is designed to solve these problems:
⚔️ Fighting "Data Dumping":
Our AI analyst doesn't just check grammar. It scans your report for key analytical language. It checks if you've explicitly identified and described the peaks, troughs, turning points, and major trends, not just a sequence of numbers.
⚔️ Fighting "Repetitive Vocabulary":
The AI has a built-in academic vocabulary database. It automatically flags overused, basic words and offers powerful, C1/C2-level synonyms. It will suggest upgrading "went up quickly" to "soared," "experienced a surge," or "witnessed a sharp climb."
⚔️ Fighting "Missing the Big Picture":
Our AI performs a structural analysis of your essay. If it cannot detect a clear and compliant Overall statement (a summary without specific data), it will raise a "Structural Risk" alert, telling you exactly what's missing.
⚔️ Fighting "Flawed Comparison":
The AI is trained to recognize comparative language (while, in contrast to, similarly). If it detects you are merely describing separate trends without these logical connectors, it will prompt you to add sentences that directly compare the data points.
It sounds powerful in theory, but the results are what matter.
Case Study: Refactoring a Band 6 Report to a Band 8 with AI

Real transformation: From Band 6 to Band 8
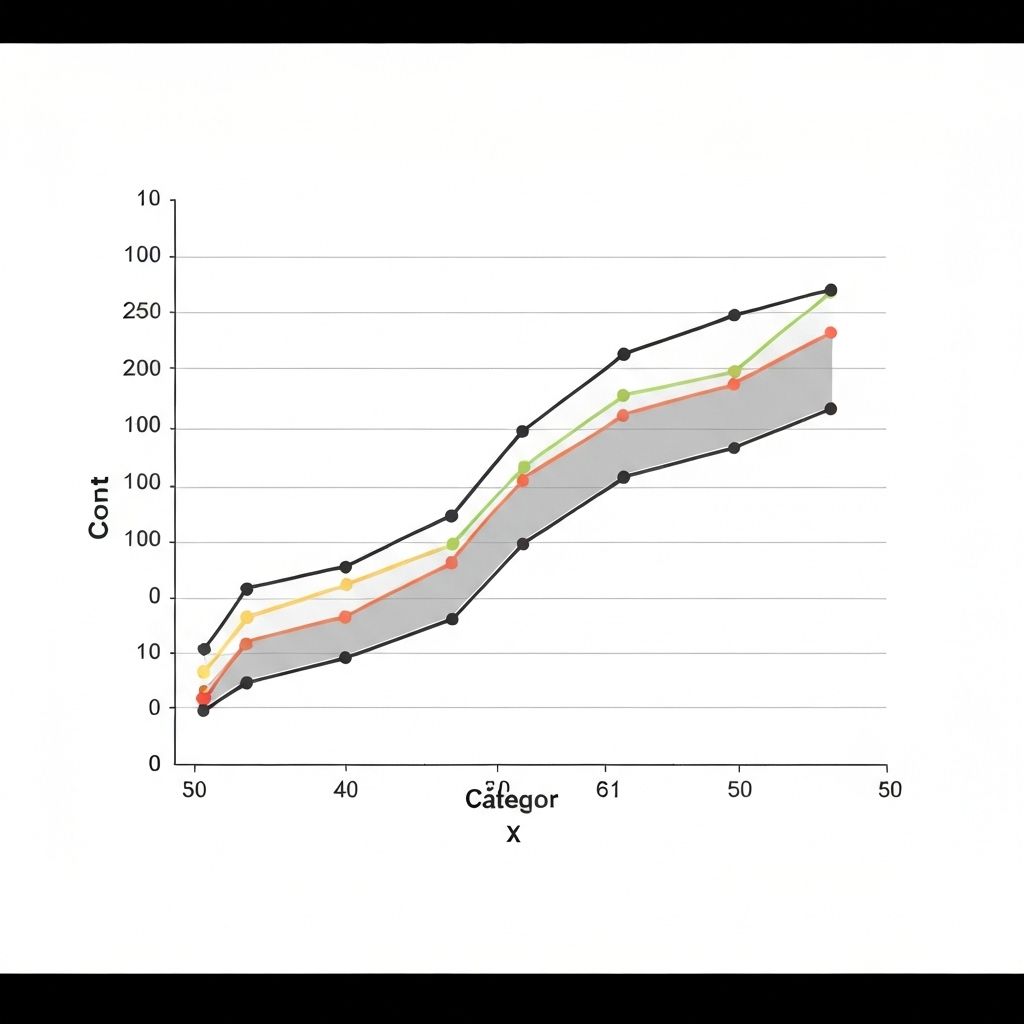
Let's take this very real example. Here is a typical Band 6 response for a line graph showing car sales for Ford and Honda from 2010 to 2020.
The Band 6 "Before" Version:
"The graph shows car sales for Ford and Honda. In 2010, Ford sales were 50,000. It went up to 60,000 in 2012. Then it went down. For Honda, sales were 40,000 in 2010. Sales went up a lot. In 2020, Ford sales were 70,000 and Honda sales were 80,000. Overall, sales for both companies increased."
❌ This essay commits all four sins.
Now, let's feed it into our AI Writing Task 1 Checker.
The AI's Diagnosis:
🚨 Structural Risk Alert:
Overall statement is too simple and placed incorrectly. It fails to mention the key feature that Honda overtook Ford.
⚠️ Vocabulary Alert:
Flags "shows," "went up," "went down," "a lot" as repetitive and basic. Suggests alternatives like "illustrates," "surged," "declined," "dramatically."
📊 Cohesion Alert:
Points out the lack of comparative language. The two paragraphs are separate stories.
🔍 Data Analysis Alert:
Notes that the "peak" for Ford and the "crossover point" were not mentioned.
The Band 8 "After" Version:
"The line graph illustrates the sales figures for Ford and Honda vehicles over a decade, from 2010 to 2020."
Overall, it is clear that sales for both brands experienced an upward trend, with the most notable feature being Honda overtaking Ford as the top-selling brand in the latter half of the period.
Initially, in 2010, Ford's sales stood at 50,000 units, which was 10,000 higher than Honda's. Ford's figures then climbed to a peak of 60,000 in 2012 before experiencing a gradual decline. In contrast, Honda's sales began a dramatic surge, and by approximately 2016, its sales figures surpassed those of Ford.
From 2016 onwards, Honda continued its strong growth trajectory, ultimately reaching a high of 80,000 units sold in 2020. Meanwhile, Ford's sales recovered and also ended the period at a higher point of 70,000, though it remained the second-best seller."
✅ The difference is night and day. The "after" version is not just better English; it's a better data report.
Watch: IELTS Writing Task 1 Essential Tips
Bonus: Your Ultimate Task 1 Vocabulary & Structure Cheat Sheet

Master high-level vocabulary for every trend type
To help you put this all into practice, we've compiled essential vocabulary for every type of trend and sentence structures for every chart type.
| Trend Type | Basic (Band 6) | Advanced (Band 8) |
|---|---|---|
| Increase | went up, increased | surged, soared, witnessed a sharp climb, experienced an upward trajectory |
| Decrease | went down, decreased | plummeted, declined sharply, experienced a downturn, saw a dramatic fall |
| Stability | stayed the same, didn't change | remained stable, plateaued, leveled off, showed negligible variation |
| Fluctuation | changed a lot, went up and down | fluctuated considerably, experienced volatility, exhibited erratic behavior |
| Peak/Trough | highest point, lowest point | reached a zenith, peaked at, hit a nadir, bottomed out at |
📚 High-Scoring Vocabulary Toolbox
Your complete reference for Band 8+ vocabulary. Bookmark this section and use it when writing your Task 1 reports!
Upward Trends (Increase)
| Speed | Verb Forms | Noun Forms | Example Usage |
|---|---|---|---|
| Sharp/Rapid | soar, surge, rocket, skyrocket, shoot up | a surge, a leap, a jump | Sales soared from 10% to 45% |
| Steady | rise, grow, increase, climb, advance | a rise, growth, an increase | There was a steady rise in prices |
| Gradual | edge up, creep up, pick up | a gradual increase | Demand crept up slowly |
| Significant | double, triple, quadruple | a doubling, a tripling | Output doubled within 5 years |
Downward Trends (Decrease)
| Speed | Verb Forms | Noun Forms | Example Usage |
|---|---|---|---|
| Sharp/Rapid | plummet, plunge, slump, nosedive, crash | a plunge, a slump, a crash | Prices plummeted dramatically |
| Steady | fall, drop, decline, decrease, dip | a fall, a drop, a decline | A steady decline was observed |
| Gradual | ease down, drift down, slip | a gradual decrease | Sales eased down gently |
| Significant | halve, shrink by half | a halving | Revenue halved in 2020 |
Stability & Fluctuation
| Pattern | Verb Forms | Adjective/Adverb | Example Usage |
|---|---|---|---|
| No Change | remain stable, level off, plateau, stay constant | stable, steady, constant | Figures remained stable at 20% |
| Variation | fluctuate, vary, oscillate | erratic, volatile, unpredictable | Data fluctuated considerably |
| Recovery | recover, bounce back, rebound | resilient | The market bounced back quickly |
Comparative & Superlative Phrases
Comparison
- In contrast to X, Y experienced...
- While X increased, Y declined
- Similarly, both X and Y showed...
- X overtook Y in 2015
- The gap between X and Y widened/narrowed
Peaks & Extremes
- Peaked at / reached a peak of
- Hit a low of / bottomed out at
- Reached a zenith/nadir
- Was the dominant/leading category
- Accounted for the majority of...
Time Period Expressions
Start/Beginning
- • Initially
- • At the outset
- • At the beginning of the period
- • In the first year
- • Commencing in...
Middle/During
- • Subsequently
- • Over the following years
- • Between X and Y
- • During this period
- • Throughout the decade
End/Finally
- • By the end of the period
- • Ultimately
- • Eventually
- • In the final year
- • Concluding at...
💾 Pro Tip: Save This Toolbox!
Bookmark this page or capture a PDF so you can keep the vocabulary side-by-side with your drafts. A quick keyboard reminder: Cmd/Ctrl + Popens the print dialogue in any modern browser.
Prefer a one-click export? Download the full checklist insidethe AI Task 1 Checker workspace.
💡 Pro Tip: Don't just memorize these words. Practice using them in context with our AI Writing Task 1 Checker. It will tell you if you're using them correctly!
You now have the vocabulary and comparison toolkit. Run a quick check on your latest Task 1 draft and turn this guide into a concrete fix list.
Free scan first. No credit card required.
Conclusion: Task 1 Is Not Your Enemy; It's Your Opportunity

Task 1 can be your secret weapon for a high band score
For too long, Task 1 has been a source of anxiety and lost points. But it doesn't have to be.
It's the most logical, rule-based part of the IELTS Writing test. Once you learn to think like an analyst and have the right tools to check your work, Task 1 can become your secret weapon—a reliable source of high scores that boosts your overall band.
You now have the strategy and the insights. It's time to put them to the test.
Ready to Transform Your Task 1 Score?
Take an essay you've written in the past, or challenge a new Task 1 prompt. Then, paste it into our free AI Writing Task 1 Checker. See for yourself how it instantly spots the hidden flaws you've been missing.
Try AI Task 1 Checker Now →Don't let your high Task 2 score be dragged down by Task 1 ever again.
🎯 Key Takeaways
- ✅
Task 1 is a data analyst report, not an essay. Think like an analyst, not a writer.
- ✅
Avoid the 4 Deadly Sins: Data Dumping, Repetitive Vocabulary, Missing Overview, and Flawed Comparisons.
- ✅
Ensure your writing is free from common grammar mistakes that silently lower your score.
- ✅
Use our AI Task 1 Checker to identify peaks, troughs, crossover points, and other key features automatically.
- ✅
Upgrade your vocabulary: Replace basic words with C1/C2-level synonyms for higher scores.
- ✅
Always write an Overview statement that summarizes the main trend without specific data.
- ✅
Make direct comparisons between data sets using comparative language (while, in contrast, similarly).